The primary purpose of bonds is to reduce overall volatility of the portfolio, but as we are seeing today, that doesn’t mean they can’t lose money.
Understanding how bonds work is important because it can help you feel more confident in this part of your portfolio and provide context to questions you might have about their recent performance.
Measuring Return on Your Bond Portfolio
The total return you receive by holding a bond until it matures is measured by yield to maturity. That is the sum of all interest payments you receive until maturity, as well as any gain or loss of principal.
For an example, consider a bond with the following characteristics:
- 10-year term
- $1,000 face value
- $50 annual interest payment
If you bought this bond at par (meaning you paid the face value of $1,000), then the yield to maturity is 5.0%. If you bought the same bond at a discount of $900, then the yield to maturity is 5.6%.
The increase in return results from buying the bond below its stated face value. This works the other way around, too. If you buy the bond at a premium of $1,100, then the yield to maturity is 4.5%. The decrease in return results from buying the bond above its stated face value.
Bond Prices and Interest Rate Changes
Bonds experience price volatility in response to various factors, the most prevalent being changes in market interest rates.
As market interest rates rise, the prices of outstanding bonds with lower rates fall. Conversely, as interest rates fall, prices of outstanding bonds rise until their yield matches that of new bonds issued at the current rate. This relationship can be illustrated using a simplified yield calculation¹.
- If you own a $1,000 bond with an annual interest payment of $50, your current yield is 5% ($50 / $1000 = 5%).
- If market interest rates rise to 6%, your bond decreases to roughly $833.33 ($50 / $833.33 = 6%).
- If market interest rates fall to 4%, the price of your bond increases to $1250 ($50 / $1250 = 4%).
Rising rates result in immediate bond price declines, but long-term returns are enhanced due to the ability to reinvest at higher rates.
Consider the hypothetical illustration below using a bond portfolio with a yield to maturity of 2% and a duration of 3. The chart compares the cumulative total returns across three interest rate scenarios: no change in interest rates (gold), a one percentage point increase in rates (dark blue), and a one percentage point decrease in interest rates (light blue).
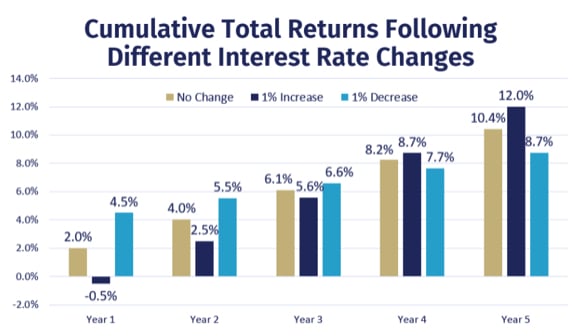
For illustrative purposes only. Illustration assumes starting yield to maturity of 2% and duration of 3. Cumulative total returns are then displayed assuming no change in interest rates or a one-time parallel shift in yields of one percentage point and then no further fluctuations in interest rates. All interest and principal are assumed to be reinvested.
…
As you can see, rising interest rates hurt returns in the earlier years as compared to the scenario where rates fall or don’t change at all. But once the holding period extends beyond the portfolio’s duration of three years, it starts to benefit your portfolio.
Conversely, the light blue lines representing the scenario of an interest rate decrease outperforms initially but begins to hurt returns after year three.
The point is important enough that it’s worth repeating: rising interest rates are good as long as your time horizon is greater than your duration. Over time, the cumulative return difference grows even more as the benefit of higher rates compounds.
In short, rising rates are not a reason to abandon a long-term asset allocation to bonds.
Drivers of Bond Performance: Term and Credit Risk
Relative returns are largely driven by the term and credit quality of a bond. Longer-term bonds experience bigger price movements for a given change in interest rates. Investors expect to be compensated for taking that extra risk as a result.
While you’ll notice that 20+ year bonds historically earn more than 5-year bonds, those modestly higher returns come with more than double the volatility. This is problematic given that the primary role of fixed income is to reduce volatility.
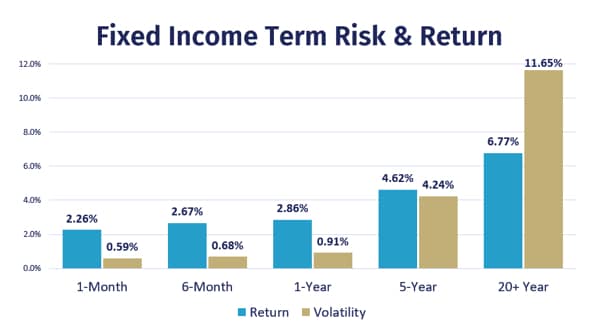
Data from Federal Reserve Economic Data (FRED) using Bank of American Merrill Lynch indices from 1992-2021. Indices are not available for direct investment. Index returns are not representative of actual portfolios and do not reflect costs and fees associated with an actual investment. Past performance is not a guarantee of future results. Actual returns may be lower.
…
Although longer-term bonds offer higher yields, they don’t necessarily offer enough of a return premium to justify the higher risk when compared to short-term bonds.
By loaning money to a company with lower credit quality, investors face a higher risk of not receiving all of the promised interest and principal payments. In addition, lower rated bonds tend to drop more in value when the economy slows because recessions lead to lower profits and increase the likelihood of default. Consequently, investors require a higher yield to compensate for taking the extra risk.
The relationship between fixed income credit risk and historical returns is depicted below. As you can see, taking additional credit risk by lending to lower quality companies produces higher returns and higher volatility.
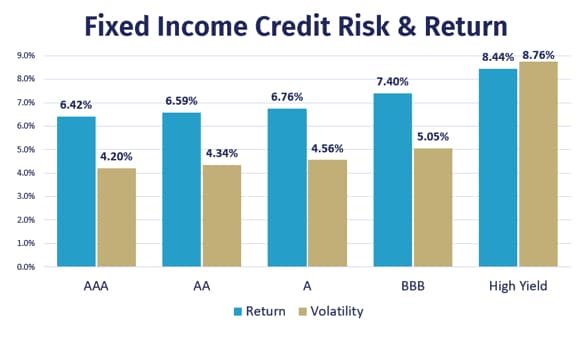
Data from Federal Reserve Economic Data (FRED) using Bank of American Merrill Lynch indices from 1989-2021. Indices are not available for direct investment. Index returns are not representative of actual portfolios and do not reflect costs and fees associated with an actual investment. Past performance is not a guarantee of future results. Actual returns may be lower.
…
However, much like our example of term risk, credit risk is only beneficial to a certain point. For example, junk bond returns are higher than BBB bonds, but they come with 73% greater volatility – not exactly something you want to see in the portion of your portfolio dedicated to safety.
Individual Bonds Versus Bond Funds
Many individual bondholders believe the implications of interest rate fluctuations don’t impact them because they’ll receive their principal value on an individual bond if held to maturity. Similarly, some people perceive bond funds to be riskier since they never mature and fluctuate in price every day.
Holding an individual bond to maturity will result in the return of principal – assuming the bond issuer doesn’t default – but those nominal dollars will be worth less with inflation and during periods of higher interest rates.
Additionally, the lack of price volatility in individual bonds is an illusion. Individual bond prices fluctuate every day, even if held to maturity. You just might not notice if the bond isn’t repriced every day.
As for the issue of bonds maturing, most individual bonds are part of a bond portfolio that never matures because investors usually reinvest the proceeds of maturing bonds into new bonds. In other words, a portfolio of individual bonds is actually a form of a bond fund. The difference is that individual bond portfolios tend to have higher costs, less diversification, and cash drag.
Investing Well Means Understanding the Basics of Bonds
While people tend to focus more of their attention towards the stock portion of their portfolios, understanding the underlying fundamentals of your bond portfolio is important. This becomes even more critical as we hit periods of increased media coverage (and speculation), like we’re seeing now.
The global bond market’s primary benchmark, the 10-year U.S. Treasury yield, recently exceeded 3% for the first time in several years. As a result, there’s been a little more noise around the bond market than usual – and you need to know how to stay your course in the midst of that increased clamor.
The primary purpose of your bond allocation is to decrease the volatility of your overall portfolio – not to earn the biggest return possible. Even if bonds experience temporary losses as interest rates rise, the worst bond markets are not as severe as the worst stock markets.
Rather than try to predict movements in the market, you should focus on the things you can control in this portion of your portfolio such as costs, our exposures to term and credit risks, and diversification.
Sources & Disclosures:
1. The example uses current yield rather than yield-to-maturity for the sake of simplicity. Also, a change in interest rates doesn’t affect all bonds equally. Duration measures how sensitive a bond’s price is to changes in interest rates – higher duration bonds experience bigger gains and losses in response to a change in interest rates.

