Are your expectations for your investment returns realistic? Investors who hold unrealistic expectations frequently make mistakes and misjudgments that negatively impact their portfolios.
Everyone wants double-digit returns, but they don’t want to expose themselves to too many losses. Unfortunately, that portfolio doesn’t exist. Setting return expectations too high can also cause investors to reach further out on the risk spectrum for incremental return, which comes with its own set of consequences.
The best portfolio will always be the one you can stick to through all market environments. Today’s market is one in which new record highs are being made on a regular basis along with steadily climbing valuations. Combine these factors with any news story or economic data point that makes you feel uncertain about the future and suddenly you might start feeling that a pullback is imminent.
Losses are normal. They should be incorporated into your financial plan. But what about extended periods of low return?
U.S. Stock Valuations Are Relatively High
Valuation is one of the best indicators of future returns – in general, we experience lower returns when valuations are high (stocks are more expensive) and higher returns when valuations are low (stocks are cheaper).
The price-to-earnings ratio (P/E) is one of the best-known metrics to measure valuation. Specifically, P/E measures how much investors pay for a dollar of a company’s earnings. As investors become more confident about the future, they’re willing to pay more for a dollar of earnings.
A variation of the simple P/E ratio is the cyclically-adjusted price-to-earnings (CAPE) ratio. Instead of dividing price by the past 12 months of earnings as we do with the simple P/E ratio, the CAPE ratio divides price by the average inflation-adjusted earnings of the past ten years. The idea is to smooth out the good and bad years created by a business cycle.
This chart shows the cyclically-adjusted price-to-earnings (CAPE) ratio using data from Robert Shiller’s online database. The red line is the historical average CAPE ratio dating back to 1926. The green dashed lines indicate a standard deviation above and below the historical average.
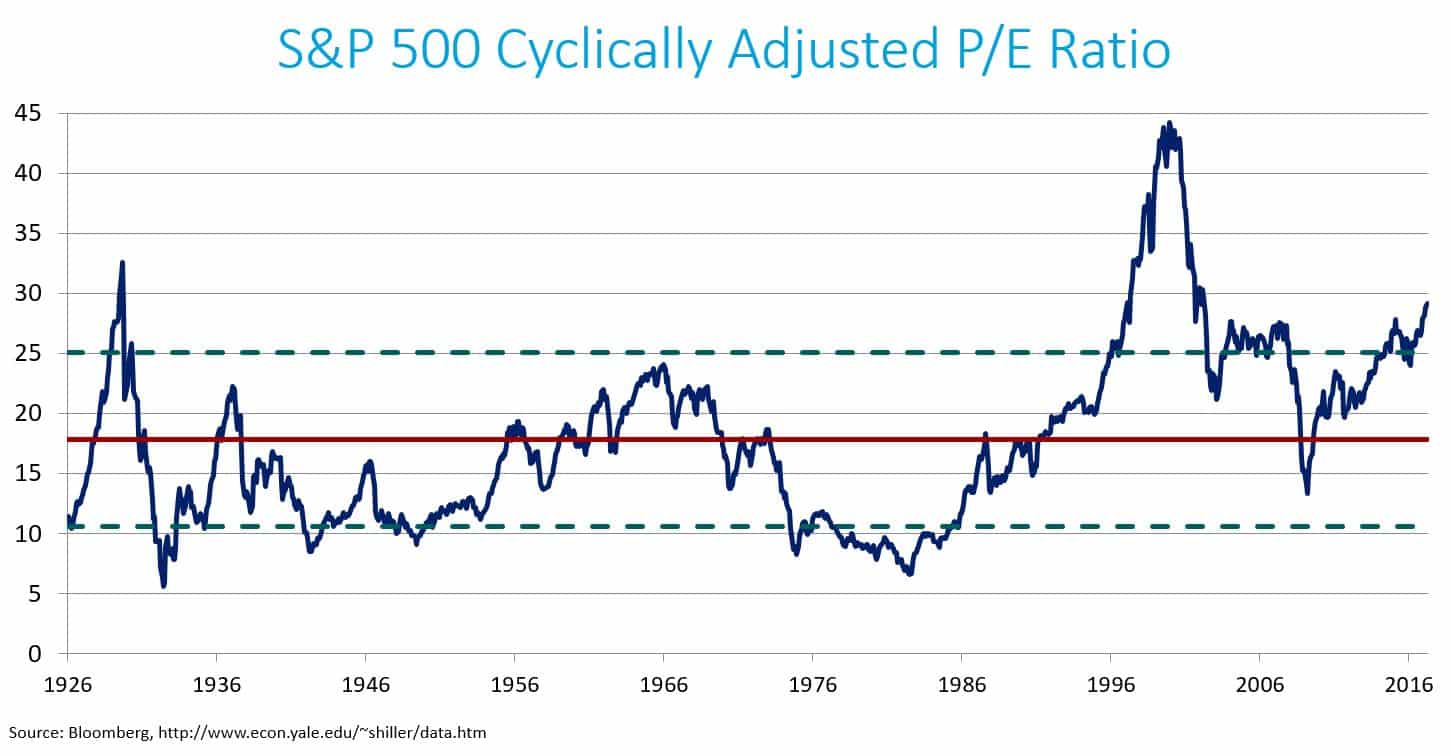
At the depths of the Financial Crisis in March 2009, investors paid about $13 for cyclically-adjusted earnings. Fast-forward to today where confidence is much higher — and investors are willing to pay more for stocks. The CAPE ratio stands at 29.
That’s high by historical standards and warrants our attention. Why? While it won’t help predict the next crash, it can help us plan for the future.
Past Returns by Valuation
Valuation is a terrible timing tool, but it is useful in setting expectations about future returns.
This graphic uses monthly data from January 1926 through April 2017 and breaks out one, three, five, and ten year returns based on where the CAPE ratio stood at the beginning of each month in the data set.
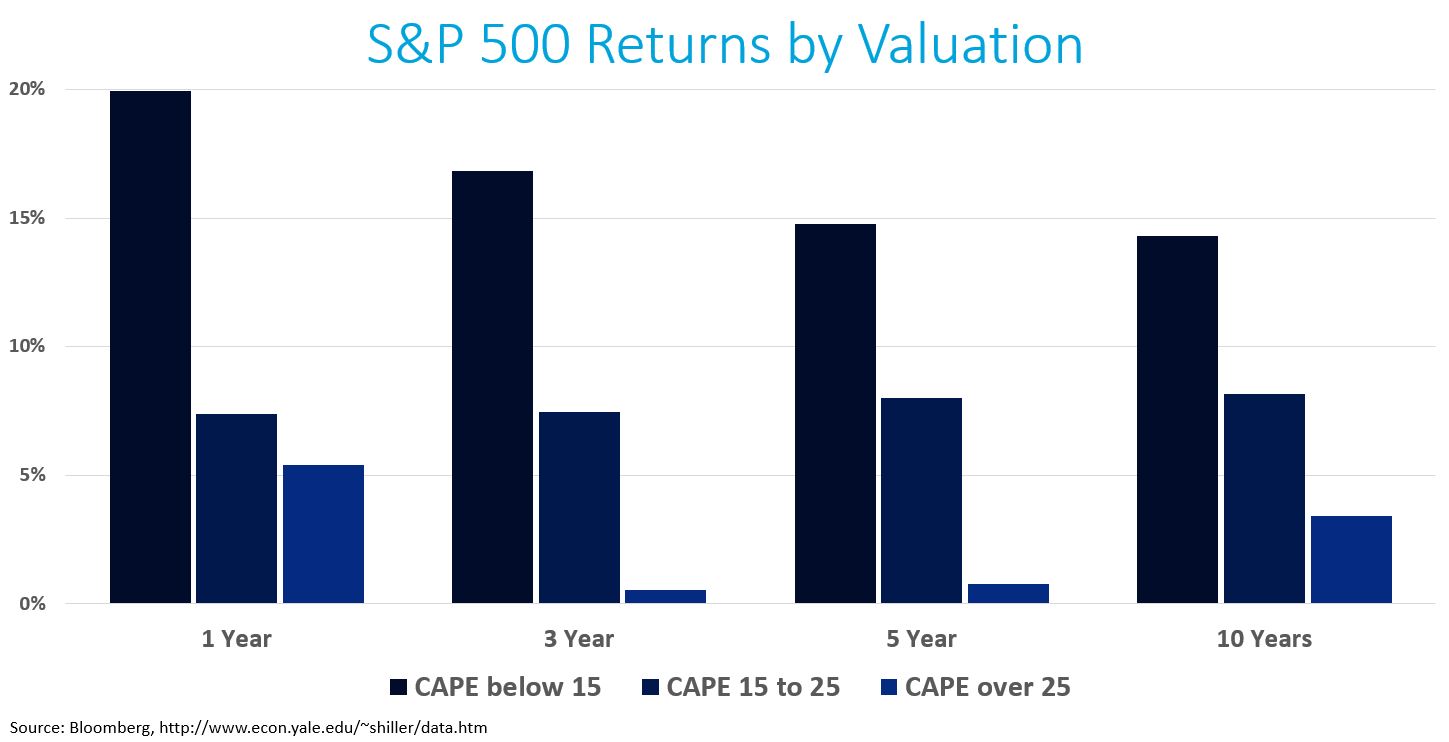
The simple takeaway is that we generally experience lower returns when valuations are high, but that isn’t always the case. The problem with accepting the chart above as the only outcome is that average scenarios don’t capture the wide range of possibilities.
The next table looks more closely at the range of returns specifically for periods following a CAPE ratio over 25, which is the situation we’re in today.
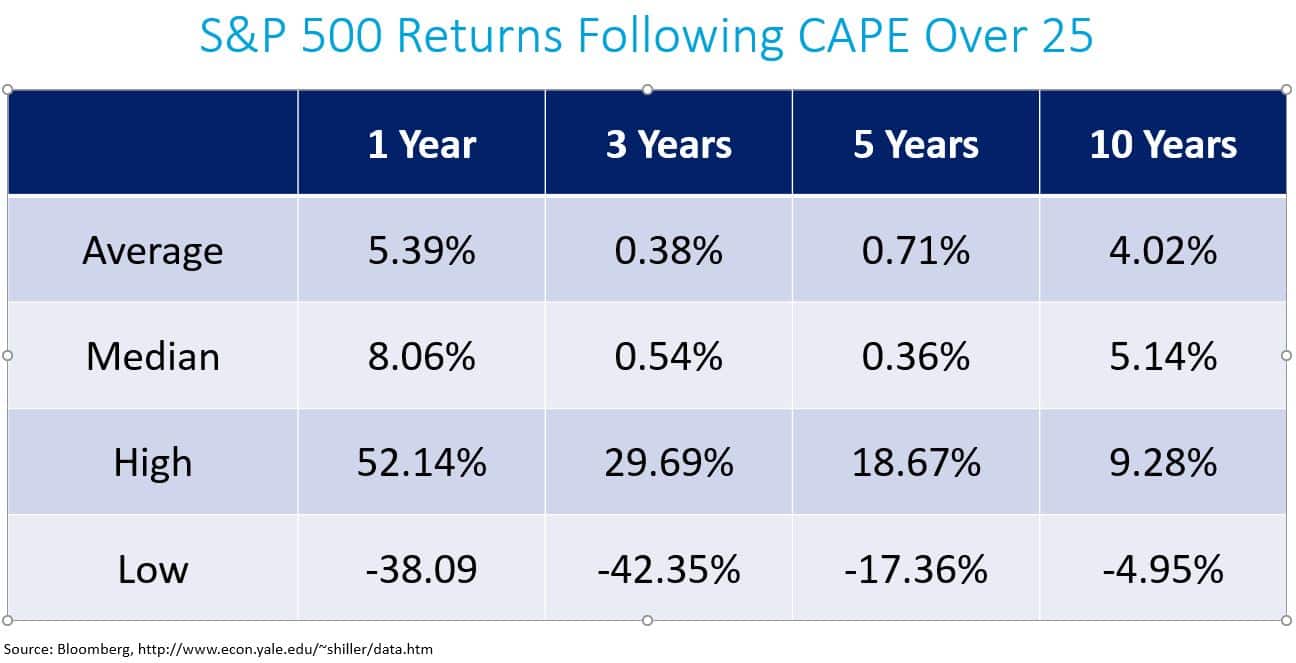
The wide range of returns – as seen by comparing the High and Low versus the Average outcome – serves as a reminder that the market doesn’t follow a set of rules. High valuations may typically result in below average returns, but sometimes they provide much better or much worse returns.
Using Valuation to Plan for the Future
It’s important to note that all of the return data above uses nominal returns, which aren’t always as relevant to the financial planning process as real returns that account for inflation. Nominal returns don’t need to be as high during periods of low inflation and low interest rates to have good financial planning outcomes.
In addition, valuations tend to stay relatively high or low levels for extended periods of time. It’s extremely difficult to predict how financial markets will perceive outcomes of the various global events occurring every day. The way I look at current valuations is that U.S. stock returns have an increased probability of trailing historical average returns over the next decade.
In a great article on the Irrelevant Investor, Michael Batnick points out that “it takes a lot of self-control to earn market returns.” Earning the market return means sitting tight during periods of low returns or negative return. This sounds easy in theory, but it’s difficult to execute in the moment.
Frequently checking your portfolio decreases your likelihood of seeing positive outcomes, which makes staying the course more challenging. Rather than watching market news like a hawk and trying to predict future returns, you’re much better off focusing on things within your control. Just knowing that losses or lower returns will occur can better prepare you emotionally for those inevitable periods of time.
Related Posts:


