Last week the S&P 500 entered correction territory, which is defined as a 10% drop from the previous market peak.
Listen now and learn:
- What recent losses mean from a historical perspective
- Why Russia and Ukraine play a smaller role in the losses than you think
- What’s actually driving market losses and where we go from here
Listen Now
Show Notes
Last week the S&P 500 entered correction territory, which is defined as a 10% drop from the previous market peak.
Throughout my entire career at Plancorp, I’ve sent out an email when the S&P 500 experiences a 10% loss to remind people that there is no reason to panic and the best thing to do is stay the course.
Every time I send this email, I joke internally with my teammates to “wake me up when we’re down 30%” because I know that 10% losses happen roughly every other year and that the average intra-year drawdown for the S&P 500 since 1950 is 13.7%.
I see these temporary losses as being incredibly normal, and simply the cost of the higher expected returns stocks provide. And my most loyal followers hear me say this all the time.
They also hear me say that we can never predict when or why the next correction will occur. So instead we plan on them occurring with a similar magnitude and frequency as they have in the past.
But even though many people hear me say these things repeatedly, living through market volatility in the moment is quite different and it can be tempting to change course because every correction seems uniquely scary. So that’s why I’ve historically sent out an email communication when the market crosses the 10% loss threshold.
But this time I didn’t send that email (at least not yet) because the major headline at the moment losses eclipsed the 10% mark was the Russian invasion of Ukraine, but market reactions to geopolitical events tend to be short-lived, and IMO the drivers of the market correction were more nuanced than the Russian invasion alone.
Fortunately, a podcast format allows me to more easily address these nuances, so I’m going to do just that by:
- Putting the recent losses in historical perspective
- Explaining the role Russia and Ukraine play in the current market environment
- Finally, I’ll share some thoughts about where we go from here.
When I’m sending out an email about a correction, I typically make the same four points each time, regardless of what’s going on in the world at the time.
1. Put the market news in historical perspective.
In this case, geopolitical events dominated the headlines when the S&P 500 loss crossed the 10% threshold. Even though I don’t Russia and Ukraine are the biggest drivers of the U.S. stock market correction, I’ll still provide some resources on that front.
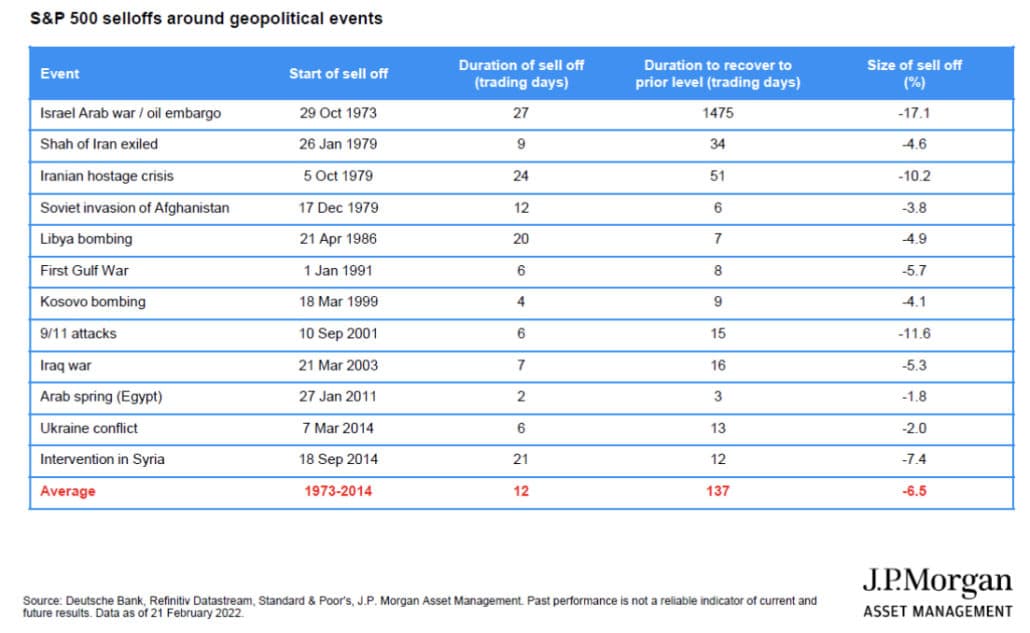
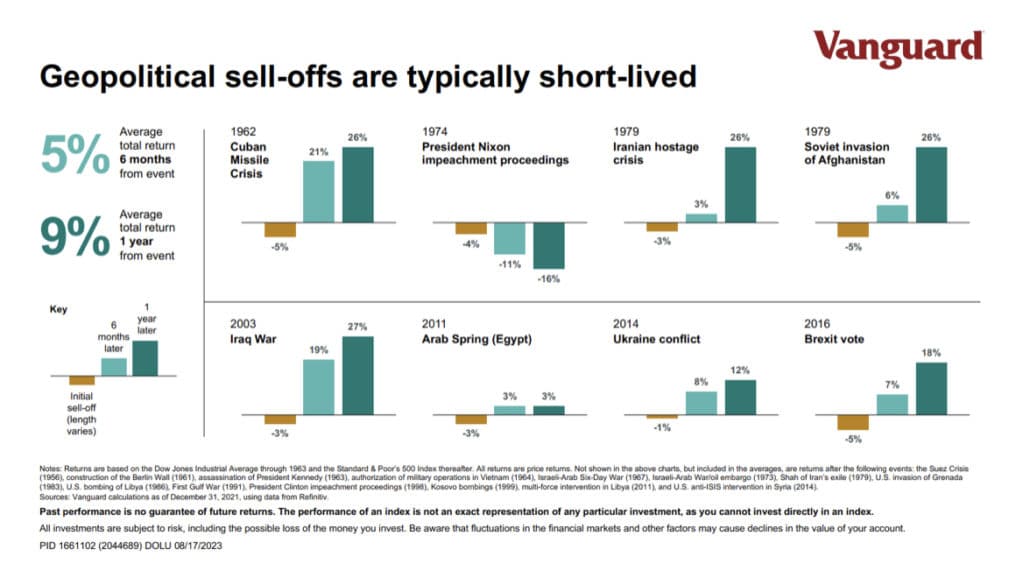
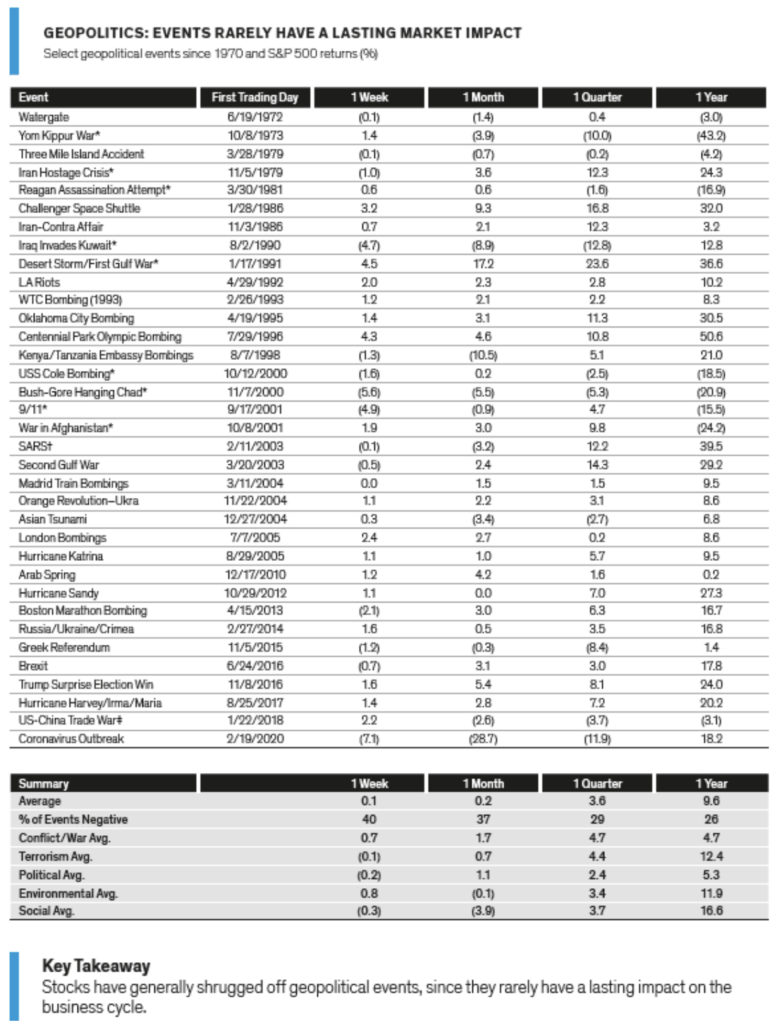
There are three great graphics I’ve included in the show notes on TheLongTermInvestor.com that show how geopolitical events rarely have a lasting impact on markets.
The first one is from JP Morgan, and it shows S&P 500 selloffs around geopolitical events. It has the start of sell off, duration and size of sell off, and duration to recover to prior level.
The second one is from Vanguard. It looks at the loss during 8 specific geopolitical events starting with the Cuban Missile Crisis in 1962 through the 2016 Brexit vote. This chart looks at the initial loss and then the returns 6 months and 12 months after the event.
The third one is from Alliance Bernstein and is probably the most comprehensive in terms of different types of geopolitical events.
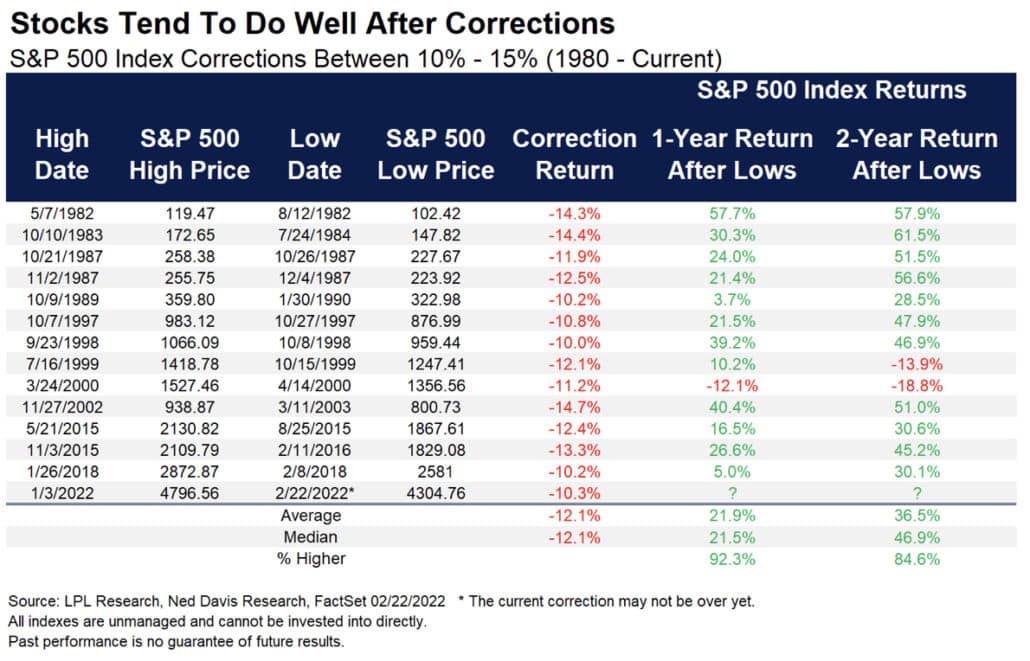
But if I were writing an email, the type of data I would use is in the fourth graphic that shows how stocks tend to perform well following corrections of 10% to 15%.
That covers the first point I typically include in a correction email is putting the current events into perspective.
2. Reacting to losses can hurt performance.
Even if you could accurately predict the future, knowing how the market will react is impossible. Going to cash requires you get it right twice — once when you sell stocks and once when you buy back in — making an already tall task insurmountable.
Plus, the best days for the stock market historically follow the worst days. Missing out on those returns from the best days basically locks in permanent underperformance versus the overall market.
3. Losses are normal.
I alluded to this earlier and it feels like I’ve said it a million times. Looking at S&P 500 data going back to 1926, double-digit losses occur in 65% of calendar years and nearly a quarter of the time losses are greater than 20%.
I also referenced earlier that the average intra-year loss for the S&P 500 is 13.7%.
These losses are the cost of higher expected returns for stocks versus cash and bonds.
There’s no way to predict when losses will occur, but you can plan on them occurring with a similar magnitude and frequency as they have in the past. Which leads me to the final point in a typical market correction email:
4. If you’re feeling concerned, the first thing you should do is review your financial plan (not your portfolio).
There is no way anyone could have perfectly predicted the variety of events of the past two months that have contributed to market losses, but we did plan on these types of losses occurring and built investment strategies accordingly. But in building portfolios, we assume that investors will stay the course, so changes to portfolio strategy are harmful.
That’s why it’s important to look to your financial plan first. If nothing has changed in your financial plan other than market prices being lower, then there shouldn’t be a need to make changes to the portfolio.
That last point is arguably the most important and it’s something I always conclude with in a volatility related communication. The world is constantly changing, but good advice remains the same and that’s largely because financial theory tends to play out over the long-term.
The challenge is that the long-term feels like an eternity in the moment, particularly when things feel more uncertain.
To summarize the four main points I make following a market correction:
- Stocks tend to perform well after a 10-15% correction
- Reacting to losses can hurt performance
- Losses are normal
- The best action is to review your financial plan.
Market Correction Autopsy
Now, let’s dig a little deeper into the nuances of the recent market moves. I’ll start by performing an autopsy of sorts.
I recently wrote about how expert predictions are nonsense, which now seems timely because it’s common — even expected — for financial experts to give concise after-the-fact narratives explaining in great detail and certainty what just occurred in markets and why. Then they turn around and tell you what will happen in the future.
Doing a market return autopsy largely ignores narratives and instead simply focuses on drivers of stock market returns.
Stock market returns (whether they are positive or negative) are driven by three things:
- Changes in earnings per share
- Cash returned to shareholders (via dividends or share buybacks)
- Changes in valuations
There are a number of ways people measure valuation, but the most common one is the price-to-earnings (or PE) ratio. Today the S&P 500 has a PE ratio of just under 25. That means that investors are willing to pay about $25 dollars for $1 of earnings.
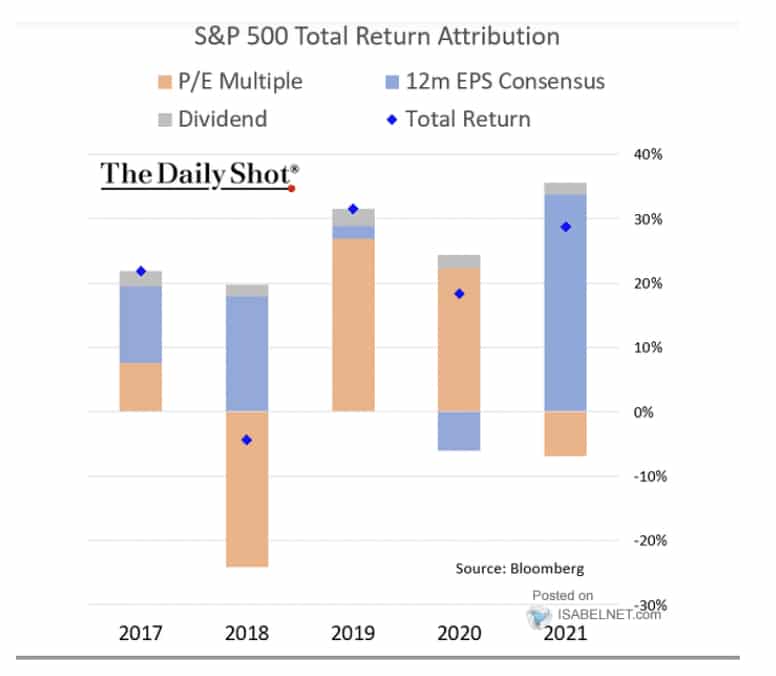
The vast majority of S&P 500 returns in 2019 and 2020 can be attributed to multiple expansions, which simply means that investors were willing to pay more for $1 of earnings.
It wasn’t until 2021 when the S&P 500 started with a PE ratio of nearly 36 that multiples began to contract, meaning that investors began paying less for a dollar of earnings growth. The PE ratio fell from roughly 36 to 26 over the course of last year, which subtracted about 8 percentage points from return.
Despite that multiple contraction, the S&P 500 still managed a total return of 28.71% in 2021 as earnings growth contributed over 30 percentage points to return.
Now, I only have full year data, so I can’t perform as precise of a market return autopsy for the two months since the S&P 500 peaked, but I can see:
- (1) Earnings growth has slowed a bit but is still positive
- (2) cash returned to shareholders appears to remain relatively stable
- (3) Valuations have contracted
The primary driver of recent market losses has been changes in valuation.
Now the question is: Why are valuations contracting?
The Russian invasion was on people’s radar earlier this year, but I believe the bigger driver in valuation contraction has been the decades-high rate of inflation and the shifting expectations towards how the Federal Reserve might respond.
After spending multiple decades below the historical average, the latest inflation report showed year-over-year inflation of 7.5%. Even though that was higher than the previous 12-month inflation number of 7.0%, the month-over-month inflation data has been falling slowly since last fall.
But above-average inflation seemed likely, so the Federal Reserve has communicated clearly that they will be tightening monetary policy more quickly than previously expected.
In my opinion, this is the primary reason market valuations have contracted. As the Fed raises interest rates in an effort to cool the economy, earnings growth is also cooling, and sentiment on the future along with the price investors are willing to pay for a $1 of future earnings has contracted.
But the Russian invasion complicates things a bit since they are the world’s third-largest oil and second-largest natural gas producer. They also control half of the world’s palladium supply, which is used in cars where supply chain problems are already pushing prices higher. Russia and Ukraine also represent more than 25% of the global wheat market.
The Fed is widely expected to raise interest rates in March, but the Russian invasion has market observers pricing in less aggressive hikes now.
Where do we go from here?
As always, where we go from here is completely unknown.
There are so many variables in play, and even if you could correctly predict the various outcomes, it’s impossible to know how the market will react to each outcome and how those reactions will interact and influence each other.
Assuming there isn’t a full-fledged World War, the annexation of breakaway states does not appear to be a substantial threat to markets. Pair that with a growing sense that Omicron is in full retreat and the economy is set to fully reopen again, and you could easily paint an optimistic picture for near-term stock returns.
On the other hand, we can’t know that the Russian conflict won’t escalate or that a new highly contagious variant won’t pop up. Plus, the Federal Reserve removing monetary stimulus will likely dampen economic growth in general.
Considering that the S&P 500 has enjoyed a roughly 13% annual return the past decade, some mean reversion towards long-term average returns should be expected.
But how things play out over the next 12 months isn’t nearly as important as how things play out for the next five, ten, or 20 years.
This type of short-term uncertainty is what drives higher returns in stocks than bonds or cash in the long run.
Resources
- Why Expert Predictions Are Bullsh*t
- S&P 500 Total Return Attribution
- Submit your question for the show through my “Ask Me Anything” form
Get Your Finance Questions Answered
Do you have a financial or investing question you want answered? Submit your question through the “Ask Me Anything” form at the bottom of my podcast page.
If you enjoy the show, you can subscribe wherever you listen to podcasts, and please leave me a review. I read every single one and appreciate you taking the time to let me know what you think.
About the Podcast

Long term investing made simple. Most people enter the markets without understanding how to grow their wealth over the long term or clearly hit their financial goals. The Long Term Investor shows you how to proactively minimize taxes, hedge against rising inflation, and ride the waves of volatility with confidence.
Hosted by the advisor, Chief Investment Officer of Plancorp, and author of “Making Money Simple,” Peter Lazaroff shares practical advice on how to make smart investment decisions your future self with thank you for. A go-to source for top media outlets like CNBC, the Wall Street Journal, and CNN Money, Peter unpacks the clear, strategic, and calculated approach he uses to decisively manage over 5.5 billion in investments for clients at Plancorp.
Support the Show
Thank you for being a listener to The Long Term Investor Podcast. If you’d like to help spread the word and help other listeners find the show, please click here to leave a review.
Free Financial Assessment
Do you want to make smart decisions with your money? Discover your biggest opportunities in just a few questions with my Financial Wellness Assessment.


